3. Market microstructure#
Market microstructure is the study of the processes and mechanisms through which financial instruments are traded in financial markets. It focuses on how different participants —such as investors, intermediaries, and liquidity providers—interact, and how their actions affect the price formation, liquidity, and efficiency of markets. Whereas many financial models often assume that prices reflect all available information, market microstructure digs deeper into the realities of trading: the role of transaction costs, bid-ask spreads, order types, and how information asymmetry influences trading strategies and outcomes.
At the core of market microstructure is the understanding that prices are not simply the result of supply and demand but are shaped by specific choices in the architecture of the market. These include:
Trading mechanisms: how in practice investors interact with each other to trade (buy or sell) instruments
Trading times and frequency: when and how often can a financial instrument be traded
Order types: how investors communicate their intention of trading
Trading protocols: what are the technical rules of the market
Transparency: which information can be given to investors to ensure they can trade fairly
By studying these elements, market microstructure helps explain phenomena like price discovery, short-term price fluctuations, and the impact of large trades.
3.1. Types of trading mechanisms#
The way financial markets are structured has a profound effect on how trades are executed, how prices are formed, and how liquidity is provided. At the heart of this structure lies the mechanism that governs how buyers and sellers interact. Broadly speaking, we can categorize trading mechanisms into three types: quote-driven, order-driven, and hybrid. Each has its unique characteristics and implications for market participants.
Quote-Driven Markets
In a quote-driven market, transactions revolve around a specialized intermediary known as a dealer or market maker. The dealer plays a central role by continuously quoting prices at which they are willing to buy and sell a given financial instrument. These quotes typically consist of two parts: the bid price, which is the price the dealer is willing to pay to buy the instrument, and the ask price, which is the price at which they are willing to sell it. The dealer profits from the spread, the difference between the bid and ask prices, and adjusts these quotes dynamically based on supply, demand, and market conditions.
In this system, investors cannot trade directly with each other. Instead, they must transact exclusively through the dealer, who provides liquidity by maintaining an inventory of the instruments and adjusting quotes to reflect market activity. This structure is particularly common in over-the-counter (OTC) markets, such as foreign exchange or bond markets, where liquidity might not be as readily available as in centralized exchanges.
An important feature of quote-driven markets is that prices are often indicative—they provide an approximation of the market but may not be immediately executable, especially for larger quantities or illiquid instruments. In many cases, a negotiation process is necessary for larger trades. Investors and dealers engage in a dialogue to finalize the trade, allowing the dealer to reassess risk and adjust prices accordingly.
Order-Driven Markets
Order-driven markets operate very differently from their quote-driven counterparts. Instead of relying on dealers to provide prices and liquidity, these markets use a central order book where buyers and sellers submit their orders. Investors place orders that specify the price at which they are willing to buy or sell a security, and the market matches these orders according to a predefined set of rules.
In an order-driven system, participants interact directly with each other through their orders. There is no negotiation process; instead, a matching engine automatically pairs buy and sell orders based on their price and the time they were entered into the system. This ensures a fair and transparent market, where prices are determined by the collective actions of all market participants.
The most common types of orders are limit orders and market orders. A limit order specifies a price at which the trader is willing to buy or sell, while a market order is an instruction to execute the trade immediately at the best available price. The order book is public, meaning that participants can see all current bids and asks, providing a high level of transparency in terms of available liquidity and market sentiment.
Order-driven markets are typical of centralized exchanges, such as stock exchanges like the New York Stock Exchange (NYSE) or futures markets. These markets tend to have high volumes of orders, allowing for continuous matching and a high degree of liquidity, particularly in actively traded instruments.
Hybrid Markets
Many modern markets blend the features of both quote-driven and order-driven systems to offer the best of both worlds. These hybrid markets are designed to provide liquidity through dealers while maintaining the transparency and fairness of an order-driven system.
One version of a hybrid market includes quote-driven mechanisms where dealers post executable prices. Unlike indicative quotes, these prices are firm and represent actual tradeable prices for specified quantities. This arrangement provides certainty for investors, especially when trading in large quantities or illiquid instruments, where the guarantee of liquidity from a dealer can be critical.
In another version of a hybrid market, dealers are obligated to participate in an order-driven system. They act as liquidity providers, continually placing passive two-way orders (both buy and sell orders) on the public order book. These dealers, often referred to as market makers, must post prices even when the market is quiet, ensuring that there is always liquidity available. This contractual obligation to provide liquidity helps maintain market stability and reduces the risk of sudden price jumps due to a lack of counter-party interest.
Hybrid markets strike a balance between dealer-driven liquidity provision and the transparency and efficiency of an order book system. They are commonly used in highly liquid markets, such as foreign exchange platforms and some modern equity exchanges, where large institutional players need the certainty of liquidity alongside the openness of an order-driven market.
Why two different market microstructures?
Each of these trading mechanisms serves different types of markets and participants. Quote-driven markets are particularly useful for illiquid or over-the-counter products, where large trades and custom negotiations are common. Order-driven markets thrive in environments with high trading volumes and transparency, offering fast execution and price discovery through collective action. Hybrid markets bring together the strengths of both systems, ensuring liquidity and fairness even in challenging trading conditions. Understanding these mechanisms is crucial for anyone looking to navigate today’s financial markets.
3.2. Trading Times and Frequencies#
The timing of trades and the frequency with which they occur are essential aspects of market design, significantly impacting how liquidity, price discovery, and volatility are managed. Different trading mechanisms operate under varying time structures, and these structures influence the behavior of market participants, the efficiency of order execution, and the stability of markets. Broadly, trading times and frequencies can be categorized into continuous trading, periodic auctions, and request-driven trading. Each of these methods plays a role in shaping market dynamics, especially under different market conditions such as periods of high volatility or when liquidity is scarce.
Continuous Trading
Continuous trading is the most common method used in modern financial markets, where trading happens continuously within a defined window of time. During this window, market participants can submit and execute orders at any moment, allowing for a constant flow of trades and real-time price updates. This method is particularly effective in markets with high trading volumes, where liquidity is readily available throughout the trading day.
Order-Driven Continuous Trading: In order-driven markets, continuous trading typically takes place using a continuous double auction mechanism. In this system, all buy and sell orders are collected in a limit order book, where they are matched based on price and time priority. The order book allows for ongoing price discovery as orders are continuously executed whenever a matching counterparty is found. Traders have full visibility of the order book, seeing both the available bids and asks at various price levels, which ensures transparency and competitive pricing.
Quote-Driven Continuous Trading: In quote-driven markets, dealers play a pivotal role in continuous trading by constantly updating their bid and offer prices for the instruments they manage. In purely quote-driven markets, these prices are often indicative, meaning they serve as guidelines and may require negotiation before a trade can be executed. However, in hybrid markets, dealers may quote firm prices, which are executable immediately for specific quantities. This ensures that liquidity is available continuously, even when direct order matching between investors is not feasible.
Continuous trading is particularly advantageous for markets with high liquidity, as it enables fast execution and efficient price formation. However, in periods of high volatility, continuous trading can exacerbate price fluctuations, as large orders or sudden imbalances between supply and demand can cause significant price swings.
Continuous Trading with Scheduled Call Auctions
To address the challenges of volatility in continuous markets, some systems introduce scheduled call auctions at key points during the trading day. A call auction is a method where all orders are temporarily pooled and then executed simultaneously at a single price, which balances supply and demand.
In a continuous trading with call auctions model, the market operates continuously but pauses at predetermined times, such as the market open or close, or during periods of heightened volatility, to conduct a call auction. These auctions help stabilize prices by concentrating liquidity into a single moment, allowing for a more orderly transition between trading sessions or a more controlled response to volatility spikes.
At the open, for example, call auctions help manage the influx of orders that accumulate overnight, ensuring that the market starts trading at a fair price that reflects the balance of supply and demand. Similarly, at the close, call auctions help establish a final price for the trading session, which is often used as a reference for pricing derivatives and other financial products.
Scheduled Call Auctions
In markets that rely on scheduled call auctions, trades only happen at specific times, rather than continuously. Investors submit their buy and sell orders in advance, and these orders are aggregated until a scheduled auction takes place. At the auction time, the market clears at a single price that maximizes the volume of trades, ensuring that the highest number of buy and sell orders are matched.
Scheduled call auctions are often used in less liquid markets, where continuous trading might lead to significant price instability due to the low number of orders. By pooling orders into a single event, scheduled auctions create concentrated liquidity and help prevent large price jumps between trades.
This method is commonly employed in initial public offerings (IPOs), where the initial price discovery process can be difficult due to uncertainty about demand. Scheduled call auctions provide a more controlled environment for determining the opening price of the security.
Request-Driven Trading
In some markets, trading does not happen on a continuous or scheduled basis but instead occurs at the discretion of the client. This model, known as request-driven trading, is often used in over-the-counter (OTC) markets for instruments that are not frequently traded or have specialized liquidity needs.
In request-driven trading, a client requests a quote or a trade from a dealer at a specific time, and the dealer responds with a price. The trade is executed based on this interaction, often involving some negotiation over the size or price of the transaction. This model is common in markets for customized or illiquid products, such as large blocks of bonds or structured financial instruments, where finding a counter-party may not be straightforward.
Request-driven trading provides flexibility for both clients and dealers, allowing them to negotiate trades that meet specific needs. However, it lacks the transparency and immediacy of continuous or auction-based systems, as each trade is typically a private transaction between the client and the dealer.
Trade-offs
The choice of trading frequency and timing mechanism reflects the unique characteristics of each market and the needs of its participants. Continuous trading offers fast execution and real-time price discovery, while scheduled auctions and request-driven trading provide alternatives that manage liquidity and volatility more effectively under specific conditions.
3.3. Order-Driven Markets and the Central Limit Order Book (CLOB)#
Order-driven markets are a fundamental type of financial market structure where prices and liquidity are determined directly by the orders placed by market participants, without the need for intermediaries such as dealers. In these markets, investors interact through a central limit order book (CLOB), a system that aggregates and displays buy and sell orders in real time. The CLOB organizes these orders based on price, ensuring that the best available prices are always visible to participants, making the system transparent and efficient.
CLOBs don’t allow orders at arbitrary prices, instead enforcing minimum price increments known as tick sizes, which define the smallest allowable difference between order prices. The tick size choice traditionally falls to the market owner, who aims to balance liquidity by setting smaller tick sizes, encouraging tighter spreads and more precise pricing. However, overly small tick sizes can also penalize liquidity providers who maintain constant bid and ask orders in the CLOB, as they may face more frequent price competition and increased order cancellations.
In recent years, regulatory bodies in some markets have implemented restrictions on tick sizes to stabilize order book structures and reduce excessive market noise. For instance, in the European Union, MiFID II introduced a tick size regime based on price levels and average daily number of trades for specific instruments, limiting the ability of markets to set overly fine increments. Similarly, in the U.S., tick size pilot programs have explored tick adjustments for smaller-cap stocks to assess impacts on liquidity and execution quality. Such regulatory measures aim to ensure fairer conditions for both liquidity providers and market participants, while supporting orderly and efficient markets.
Additionally to tick sizes, markets typically impose restrictions on the the quantities that can be traded, known as lot sizes.
3.3.1. The Structure of the Central Limit Order Book (CLOB)#
At any given moment, the CLOB provides a snapshot of the market by showing all active buy and sell orders. These orders are aggregated anonymously and displayed in two columns: one for buy orders (bids) and another for sell orders (asks or offers). Each column is ordered by price, with the best bid (the highest price a buyer is willing to pay) and the best ask (the lowest price a seller is willing to accept) at the top.
Best Bid/Ask: The best bid and ask, \(P^b_{best}\) and \(P^a_{best}\), represent the highest and lowest prices, respectively, that are currently available in the market. The difference between them is the bid-ask spread, which can serve as a measure of liquidity. A narrow spread generally indicates higher liquidity.
Market Depth: The CLOB also shows the market depth, which refers to the number of orders available at various price levels. Market depth gives traders insight into the potential for price movements based on the volume of buy and sell interest at different prices.
Mid-Price: The mid-price is calculated as the average of the best bid and best ask prices. It serves as an estimate of the fair market price at a given moment:
Spread: The difference between the best bid and ask prices. It is a metric of liquidity in the order book, since the larger it is the less likely is that investors can trade at prices close to the mid-price:
Volume Imbalance: it refers to the difference in the volume of buy orders, typically at the best bid and ask prices, although a larger number of levels might be taken for a more robust estimation. A significant imbalance can indicate potential price movement; for example, if the volume at the best bid is substantially higher than the volume at the best ask, it may suggest upward pressure on the price. This feature helps traders gauge short-term supply and demand dynamics and assess potential price changes. It is typically reported as a percentage over total volume in the best bid and ask:
The following picture shows a visualization of the order book called market depth, since it shows the current orders sitting in the book ordered by price. Each level might have orders from different participants, but we show them aggregated which is how real markets report them in their feeds.
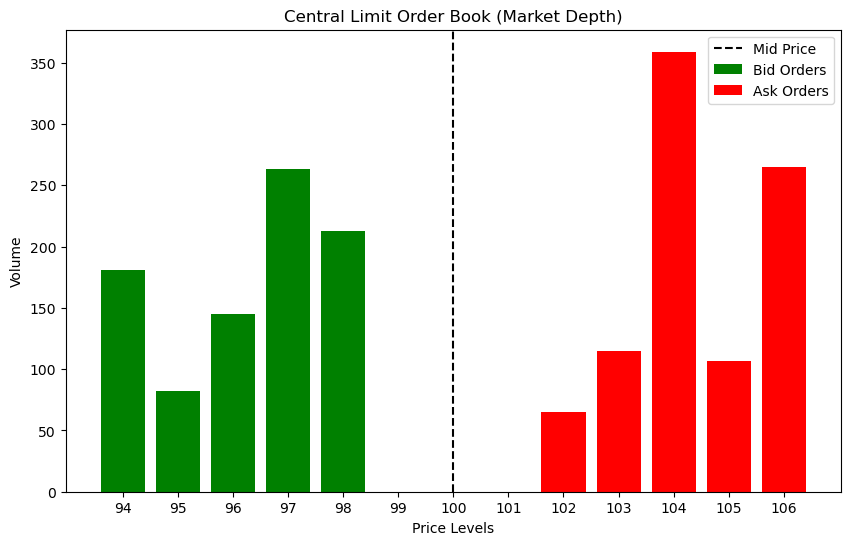
Fig. 3.1 Market Depth visualization of a Central Limit Order Book, with orders sorted by price. Volume is aggregated for the different orders in the same price level. In this example, the tick size is 1, the mid price is \(P_{mid} = 100\), the spread is \(S = 4\) and the imbalance \(I = 0.53\)#
3.3.2. Types of Orders#
Market participants in order-driven markets can use a variety of order types, each serving different trading objectives:
Market Orders: These orders instruct the system to buy or sell immediately at the best available price, consuming always the liquidity available at best prices (price priority). Market orders are executed quickly, but they carry the risk of paying a higher price or receiving a lower price than expected if there is insufficient liquidity at the best bid or ask. In this case, the order may “walk the book,” executing across multiple price levels and resulting in a higher average price (for buys) or lower average price (for sells). The execution price of an order that consumes liquidity across various levels is computed using the volume weighted average price (VWAP):
Example: Taking the previous CLOB example, suppose an investor wants to buy Suppose an investor wants to buy 500 shares with a market order. As shown in the figure below, the order consumes liquidity up to three levels. The resulting execution price is 103.51. After the market order, the mid-price is recalculated given the new liquidity, to \(P_{mid} = 101\), and the spread broadens to \(S = 6\)
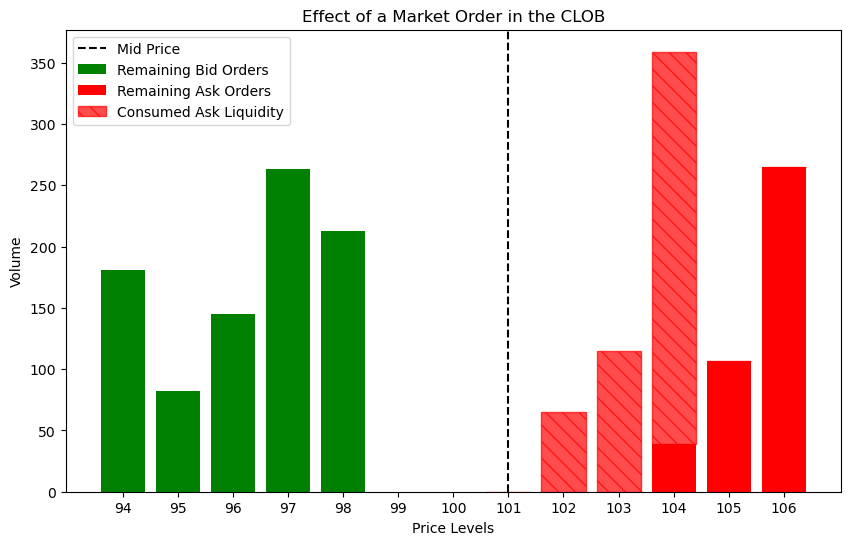
Fig. 3.2 Effect of a buy market order of size 500 in the Central Limit Order Book.#
Limit Orders: These specify a price at which the trader is willing to buy or sell. If the limit price is not immediately available to trade, the order remains in the order book until a matching counter-party arrives or the order is canceled. Limit orders allow traders to control the price at which they execute but come with the risk that the order may not be executed if the market price moves away from the limit.
When an order is added to a level with existing liquidity, there is the question of which order has the priority when a matching order arrives at the CLOB. Most markets use a time priority or first in first out (FIFO) rule, in which orders that arrived earlier are consumed first. It is not the only rule, though. For instance some markets use a pro-rata rule, in which all existing orders are consumed proportionally to their size.
Example 1: Using again the previous order book, suppose and investor wants to buy the 500 shares but instead of sending a market order, it uses a limit order at price 98. Since there are order existing at that price level, the order sits at the bottom of the level. If this is a market with a time priority rule, this means this order will be the last to be consumed at the level. After placing the order, the mid-price and the spread does not change, but the imbalance is affected, see figure below.
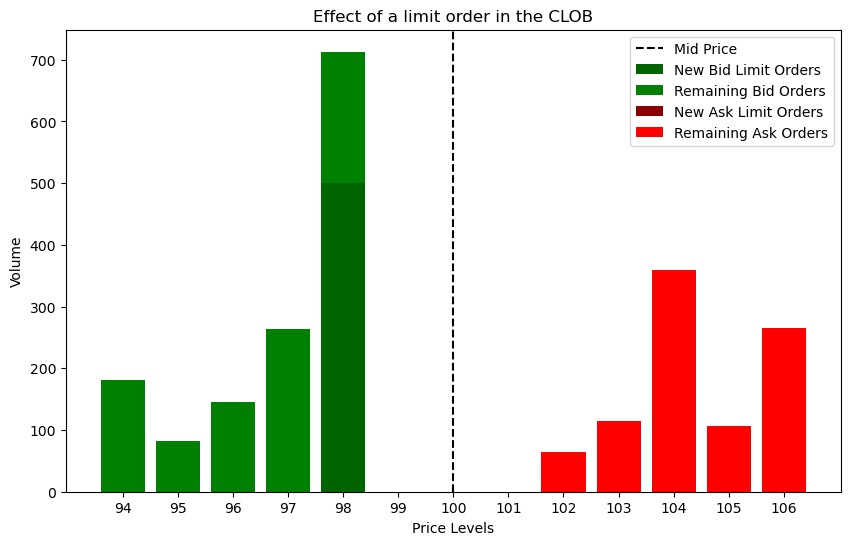
Fig. 3.3 Effect of a buy limit order of size 500 and price 98 in the Central Limit Order Book.#
Example 2: If the investor instead places the order at price 102, there is partial matching liquidity at this level. A partial execution of the limit order happens at price 102, with the remaining order sitting now at this price level. The new mid-price is \(P_mid = 102.5\) and the spread \(S = 1\).
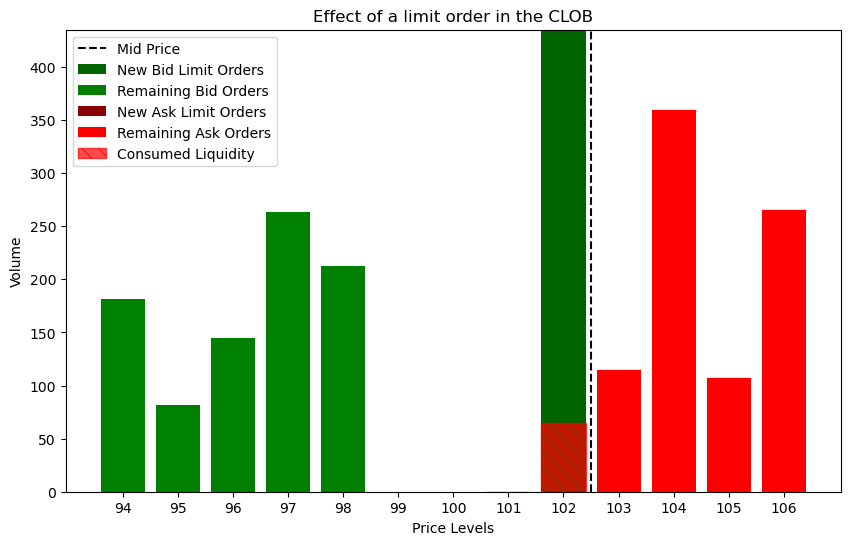
Fig. 3.4 Effect of a buy limit order of size 500 and price 102 in the Central Limit Order Book. A hatch pattern is used to show the consumed liquidity by the limit order.#
Hidden Orders: Hidden orders are limit orders that are not visible to other market participants. They allow traders to conceal their trading intentions, which can be advantageous in avoiding market impact or revealing their strategy to others. However, hidden orders generally have lower priority compared to visible orders at the same price level, meaning they will only be executed after all visible orders at that price have been matched.
Prevalence: Estimates suggest that hidden orders can account for approximately 10% to 20% of total liquidity on major exchanges like the NASDAQ or NYSE. The prevalence of hidden orders tends to increase during periods of high volatility or when large institutional players are active.
Other Order Types:
Market-to-Limit: Begins as a market order but converts into a limit order if only part of the order is filled.
Immediate-Or-Cancel: Any unexecuted portion of the order is canceled immediately after partial execution.
Fill-Or-Kill: The order is either executed in full immediately or not at all.
All-Or-None: Similar to Fill-Or-Kill, but the order may remain active if it cannot be immediately executed.
Stop Orders: Triggered when a specified price is reached, turning into a market or limit order based on conditions. For example, a price based condition that will sent a market order if the mid-price of a financial instrument goes below a certain price level.
3.3.3. Trading Fees#
Trading fees are an important consideration in order-driven markets, as they can impact the overall cost of executing trades. Exchanges generally apply fees based on the type of order and the participant’s role in providing or taking liquidity. The common fee structures include:
Maker-Taker Model: This model differentiates between liquidity providers (makers) and liquidity takers. Makers, who place limit orders that add liquidity to the order book, are typically rewarded with a rebate, while takers, who execute against existing orders and remove liquidity, are charged a fee. This model incentivizes the addition of liquidity to the market.
Inverted Maker-Taker Model: In some cases, the exchange may use an inverted model, where takers receive a rebate, and makers are charged a fee. This is used to attract more aggressive trading and increase market activity.
Flat Fee Model: Some exchanges charge a flat fee per transaction, regardless of whether the participant is adding or removing liquidity. This approach provides simplicity and is often used in less active markets.
The specific fee structure and the level of fees depend on various factors, including the type of asset being traded, the exchange, and the participant’s trading volume. In some markets, high-frequency traders may receive favorable fee arrangements due to the large volumes they generate, which contribute significantly to market liquidity.
3.3.4. Types of Order Book Data#
Order-driven markets often provide different levels of data to market participants, depending on their needs:
Level I: This basic level shows only the best bid and ask prices, giving traders a minimal snapshot of the market.
Level II: More advanced, this level displays multiple bid and ask levels beyond the best prices, giving insight into the market depth.
Level III: The most detailed level of data, showing individual orders, their sizes, prices, and time stamps. This information is typically used by algorithmic traders and market makers to track the behavior of specific market participants.
Historical data from order books is called tick data, and captures every change that occurs in the order book. It is provided by the exchanges or via financial data companies like LSEG (ex Refinitiv) and Bloomberg, which aggregate and normalize this data. There are also free resources with samples of data like Lobster.
Tick data generally comes in two forms:
Order Book Snapshots: also known as market-depth data, this form of tick data provides detailed information about the order book at specific time intervals, showing the number of buy and sell orders at various price levels. Order book snapshots allow traders to assess liquidity and understand the potential for price movements based on supply and demand. For example, a trader using order book snapshots can identify a large concentration of sell orders at a specific price level, indicating potential resistance.
Message Data: this data records all order book events, such as order submissions, cancellations, and executions, with timestamps. Message data allows traders to reconstruct the order book and analyze the flow of activity in real time. For instance, a trader reviewing message data might notice a series of large buy orders submitted successively, indicating strong buying interest and potentially signaling an upward trend.
3.3.5. Advantages and Challenges of Order-Driven Markets#
The CLOB system provides significant pre-trade transparency, as market participants can view the full order book and adjust their strategies based on available prices and liquidity. This transparency promotes price discovery, helping ensure that prices reflect the collective expectations of all market participants.
However, the system is not without challenges. In less liquid markets, price volatility can be higher due to the lack of continuous buy and sell interest. Large market orders can “sweep” through multiple price levels, causing significant short-term price fluctuations. Moreover, the transparency of the system can also lead to front-running, where certain traders take advantage of visible large orders by placing their own orders ahead of them.
To mitigate these issues, many markets incorporate mechanisms like circuit breakers and trading halts during periods of extreme volatility, as well as opening and closing auctions to establish stable prices at the beginning and end of trading sessions.
3.4. Quote-driven markets: the Request for Quote protocol#
Central Limit Order Books have become the cornerstone of market microstructure given their efficiency in matching continuously buying and selling interest, while at the same time offering valuable information for price and liquidity discovery to other investors and market participants. However, for their well functioning they rely on having enough liquidity in the form of visible bid and ask limit orders. A relatively empty order book discourages other investors to post their orders, becoming a self-fulfilling prophecy. It also becomes less useful as an engine for price and liquidity discovery. Market operators and even Governments try to incentive this market structure, for instance by offering attractive fees to liquidity providers like banks in exchange of keeping bid and ask limit orders most of the time in a trading session.
However, for some financial instruments this is insufficient. Take corporate bonds. Companies usually only issue a single stock, but might have hundreds of different bonds in circulation with different maturities, coupon types, amortization types and contractual clauses. They do so to attract different type of lenders and adapt to specific economic conditions and / or forecasts. As a result, many of those bonds trade very infrequently, making central limit order book relatively useless for market participants to find counter-parties to trade with. The same happens, for example, with most but the less standard derivatives.
The market solution to trade those instruments has been traditionally to rely on intermediaries:
Brokers, who have an extensive network of market participants that use to find a potential match to an order, charging a commission for the service
Dealers, typically banks, who are willing to buy at a discount or sell at a premium, keeping the instruments in their inventory until a counter-party is found. Therefore, in contrast with brokers, they take on inventory risk since they don’t typically can liquidate the position taken quickly, sometimes keeping inventory holdings for extensive periods of time.
Investors who want to trade illiquid financial instruments would contact brokers or dealers by “voice” (which nowadays means usually by email or chat, sometimes by phone), requesting them quotes and in case of matching interests, trading over the counter, i.e. bilaterally out of market structures.
Whereas this is still the case for some financial instruments, with the advent of electronification in financial markets, broker-dealers started building electronic platforms to allow their clients to request them quotes. Such single-dealer-to-client (SD2C) platforms have the advantage of simplifying and automatic partly both price discovery, trading and settling later the trade, but being proprietary of the broker-dealer, clients were potentially missing the benefit of competition, unless they kept multiple accounts with different broker-dealers.
This opened up a business opportunity: electronic multi-dealer-to-client (MD2C) platforms, where clients can request quotes simultaneously to multiple dealers in competition. To make clients select them as dealers, broker-dealers typically also provide indicative streams of prices for standard volumes of the contract, which are helpful for price discovery. Therefore, those platforms operated by providers like Bloomberg, MarketAxess or Tradeweb, have become the standard alternative to centralized exchanges based on the Central Limit Order Book for illiquid instruments. At the heart of the platform is a standard request for quote (RfQ) protocol to interact between client and broker-dealers.
3.4.1. Mechanics of the RfQ protocol in MD2C platforms#
A client request a quote to a number of dealers \(N\) preselected in the electronic platform. The platform sends the RfQ to the selected dealers, who have a maximum time specified by the platform to answer with a quote. As dealers respond, the client receives the quotes immediately, and can decide to trade at any time, or walk away in case she does not want to trade with any of the dealers. When they are willing to trade, though, they are forced to trade with the dealer that offers the most competitive quote. A sketch of this process is shown in the figure below.
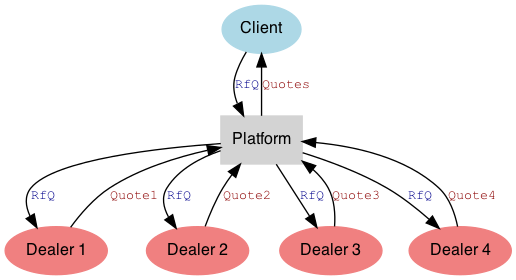
Fig. 3.5 Sketch of the RfQ protocol in a MD2C platform with four dealers in competition#
Dealers have the following information pre-trade:
The client’s identity
The instrument, size and side for which the client request a quote. There is a special type of RfQs called Request for Market (RfM) where dealers don’t know the side and are requested to quote simultaneously bid and ask quotes.
The number of dealers in competition, although they don’t know their identities
Some platforms offer a composite of indicative dealer’s quotes for specific sizes, using proprietary methodologies. For instance Bloomberg’s CBBT for bonds or MarketAxess CP Plus. However, they don’t know the actual quotes that dealers in competition are sending to the client.
Once the client decides to trade or walk away, dealer’s have typically access to the following information post-trade:
If they are chosen to trade, they know the second best price that was quoted by dealers in competition, which is called the cover price. This information is useful to understand how competitive are their prices with respect to other dealers and adjust them if they see consistent biases across many RfQs.
If they quoted the second best price (the cover price), they are informed that they were cover, although they don’t get informed of the price at which the client traded.
In any other case, they know if the client traded or just walked away, and implicitly that they were not cover since they did not get informed of being cover.
Depending on the instrument and the regulation, dealers are requested to publish later information about trades in public repositories, which typically uphold the information for a time until it is released, which can be as short as 15-20 minutes and as long as multiple days. This is the case for instance for bonds in Europe, where MiFID 2 regulation requests that trades are published in public APAs (Approved Publication Arrangements). In the USA, FINRA has a similar requirement to publish trades in TRACE (Trade Reporting and Compliance Engine). There are also private information sharing schemes like Trax, where dealers willingly share information about trades to get access to information from other dealers, typically with some limitations in instrument universe, aggregation of volumes and prices over time periods, etc.
3.4.2. Request for Streaming (RfS)#
A related protocol to RfQ is Request for Streaming, in which dealers are asked by the client to provide executable prices for a period of time for particular sizes. The client can accept the price at any time.
3.4.3. Strategic considerations for dealers and clients#
The existence of MD2C platforms for clients has the advantage of providing competition to dealers who are then forced to provide better prices to clients than in proprietary SD2C platforms. However, in practice, clients don’t usually select the maximum number of dealers allowed by the platforms (which can be around 20 or 30). The reason is that doing so has the trade-off of informing multiple dealers of the client’s intention to trade. Even if a dealer does not end up trading with the client, this information might be relevant to consider potential short-term movements in the market, and might be exploited by them although in some jurisdictions this is considering an illegal practice of front running the client.
Dealers might also be discouraged to quote competitively to win the RfQ when they see a lot of dealers in competition for similar reasons: dealers typically hedge their positions after trading using similar instruments and liquid markets. Therefore, other dealers might take advantage of potential short-term movements in the hedging instruments after trading, and take advantage of them, front running the winning dealer. They will also have a better idea of inventory positions in the market, and therefore potential needs to liquidate them aggressively in adverse scenarios.
This means that in practice clients tend to carefully balance the number of dealers in competition to get the benefit of competition without providing too many of them with valuable trade information.
For dealers, the quoting decision has also multiple strategic considerations. Apart from the fact that deciding to trade with multiple dealers in competition might be risky due to potential front-running effects in the hedging instruments, choosing the optimal quote is a complex problem that is actually prone to the use of mathematical and statistical analysis, as we will see in other chapters. For the moment, consider the following trade-off:
quote too aggressively (i.e. with prices that are more likely to be accepted by the client) and they might trade with the client at the expense of profits.
quote too conservatively and they might be consistently out-competed by other dealers.
To find the right balance, dealers tend to monitor metrics like:
hit&miss, i.e. the ratio of trades (hits) with them over the ratio of total trades with other dealers (hits plus misses). A hit&miss that is consistently too high signals a quoting policy that is too aggressive, whereas if it is too low the policy might be too conservative.
the distance to the cover price, to analyze how far are they quoting with respect to the next dealer. Small distances to cover are an indication of a healthy pricing policy.
Dealers need to have other considerations in mind when quoting. For instance, some clients typically request quotes without the intention to trade, just to get information about price levels in illiquid instruments (price discovery). Unless dealers are using trading algorithms, it is convenient to flag those clients and don’t spend time providing them quotes.
Other clients might have hidden information to the dealer when requesting quotes, that will later adversely affect the dealer. For instance, if they are sending a large order to multiple dealers split in small sizes, so each set of dealers only see a part of the full order. As mentioned, when hedging those orders the market for the hedging instruments might have a large price impact from the multiple dealers, costing them profits from the hedging size. In other cases, clients might have consistently better information about short-term price movements due to better market intelligence or insider information. Those flows are therefore adverse or toxic to the dealers, and they need to identify those clients before-hand in order to avoid potential losses in their trading books when trading with them.
3.4.4. RfQ Data#
RfQ data is more difficult to come across than order book data since it is proprietary to the dealers quoting. Some agreements have been done in the past between dealers and researchers to share data, but public data is not widely available. RfQ datasets are usually offered in two levels of aggregation:
Full negotiation history: those typically contain the full history of the negotiation, including intermediate states in which the dealer might update quotes before the client decides to trade.
Final negotiation status: in this case, the dataset only offers the final status of the negotiation, i.e. if the client traded with the dealer, traded away or walked away.
In both cases, the dataset typically includes the type or RfQ (RfQ, RfS, RfM), the timestamp of the status update, the client name and/or ID, the instrument name and/or ID, the size, the side, the price quoted by the dealer and the status. Additional information like the composite mid-price provided by the platform and additional market data might also be included.
3.5. Financial Security Identification Codes#
To conclude the chapter, let us review various unique identification codes that are used to uniquely identify financial instruments. These codes ensure clarity and reduce errors in transactions:
Ticker Symbol: A ticker symbol is a unique identifier assigned to a specific security listed on an exchange or traded publicly. All listed securities have a unique ticker symbol, which facilitates their identification during trading. Example: IBM, MSFT
ISIN (International Securities Identification Number): The International Securities Identification Number (ISIN) is a globally recognized identifier based on ISO standards. It uniquely identifies a security regardless of its currency or the exchange on which it is traded. However, to specify the exchange, another identifier, such as the Market Identifier Code (MIC), is often required. ISINs are widely used for bonds, equities, warrants, commercial paper, and most listed derivatives. Example: LT0000610040
CUSIP (Committee on Uniform Securities Identification Procedures): The CUSIP is an identifier used primarily in the United States to represent stocks and bonds. It consists of nine characters: the first six denote the issuer, the next two specify the type of instrument, and the last is a control digit. Example: 008000AA7
SEDOL (Stock Exchange Daily Official List): The SEDOL code is used for securities trading on the London Stock Exchange and other exchanges in the United Kingdom. It is particularly useful for securities not traded in the United States. While SEDOL does not depend on the exchange, the MIC is required for specifying the exchange. Example: B0WNLY7
RIC (Reuters Instrument Code): The Reuters Instrument Code (RIC) is a proprietary code used by Reuters to identify financial instruments and indices. It consists of two parts separated by a period (“.”). The first part represents the instrument, while the second, which is optional, denotes the exchange. Example: MSFT.OQ